Oahu Waste Organizer (O.W.O)
As of writing, trash audits across UH campuses have a very primitive way of storing and calculating data. It consists of a single piece of paper and one very hard working individual. One representative is in search of a more streamlined solution of storing the data.
Our solution to this problem is to create a user-friendly web application that utilizes intuitive design to streamline data input and visualization. In other words, make trash data more pretty! In this way, the need for physical pencil and paper is eliminated, relieving the stress of getting a physical copy dirty and converting the copy manually into charts and graphs. This is a quick and sustainable solution that makes a tedious job easy.
This project was our submission for the Hawai’i Annual Code Challenge (HACC) 2018 competition, consisting of members Leighton Villanueva, Alton Lee, Emily Pang, Jake Weber, Nicholas Lum, Ethan Chow, Jordan Ooka, Cristian Aspacio, and Ty Uehara. This project was updated for our ICS 314 final project.
Links
- Deployed app
- GitHub page
Features
- Data can be inputted on an easy-to-use interface
- Audit events are organized by latest dates first
- Charts and Graphs reflect all collected data per audit
- Text-to-speech for ease of input
- Heat maps for data visualization
- Simple yet informative graphs of previous and current trash audits
- Projections of possible impacts on the campus and environment
How it works
Audit Timeline
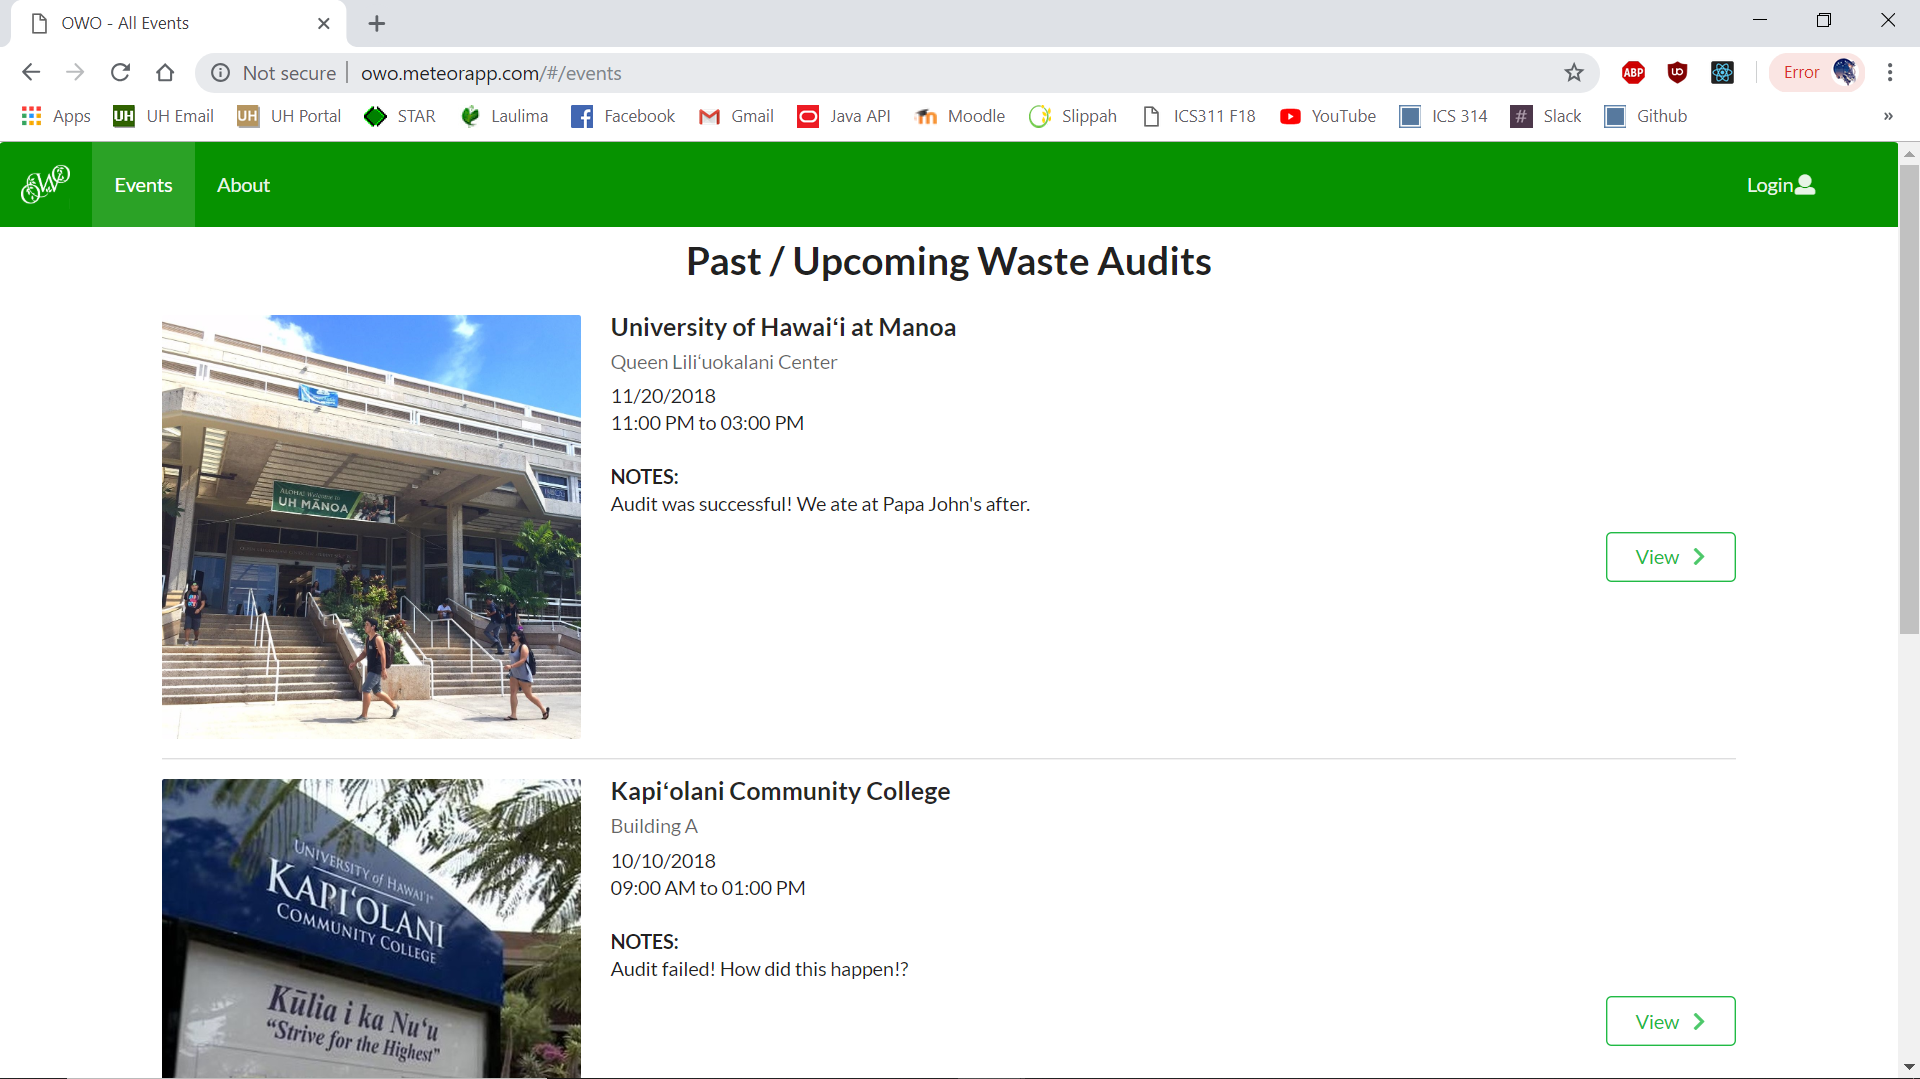
All users can view details of past and upcoming waste audit events within the UH campuses. Users can also check within each event how much trash was recorded at that campus’s building.
Data Visualization
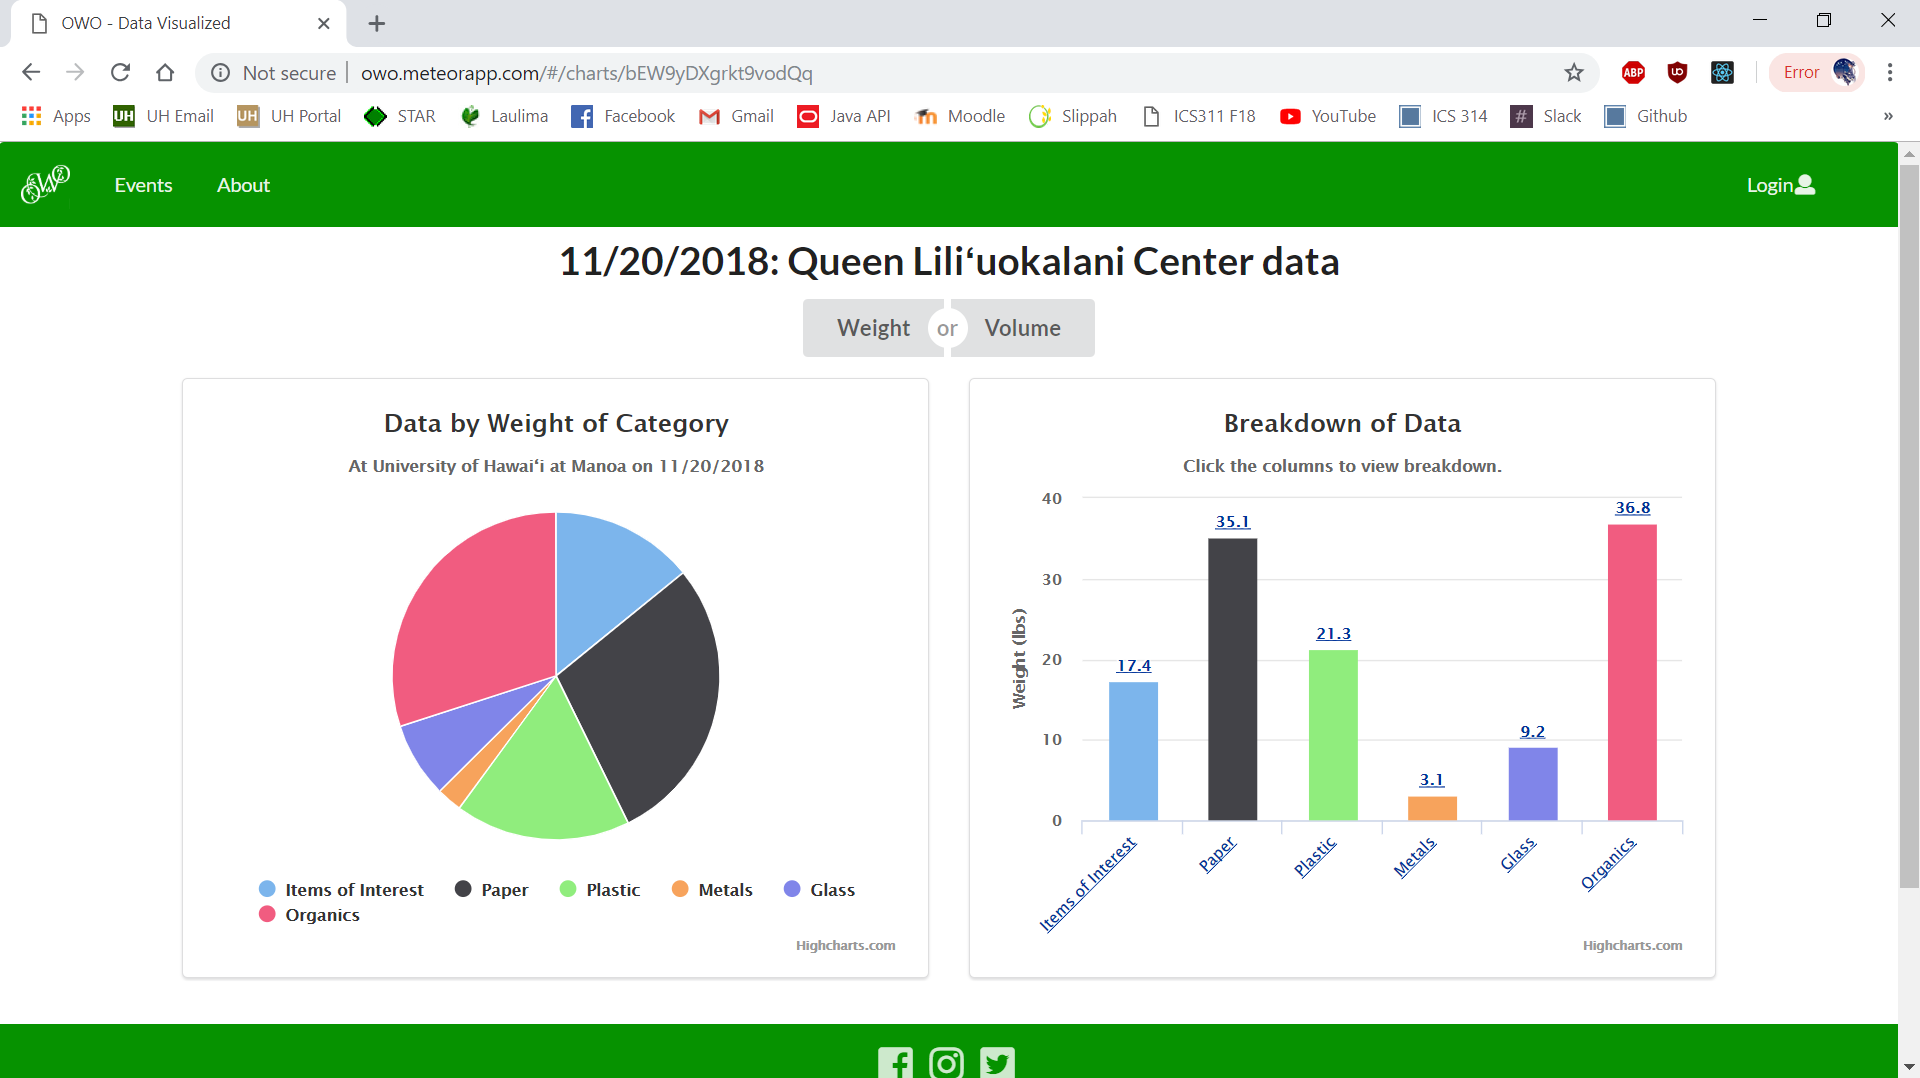
Graphs reflect either weight or volume data of each category. Users can also view the breakdown a category of trash using the bar graph on the right.
Account Types
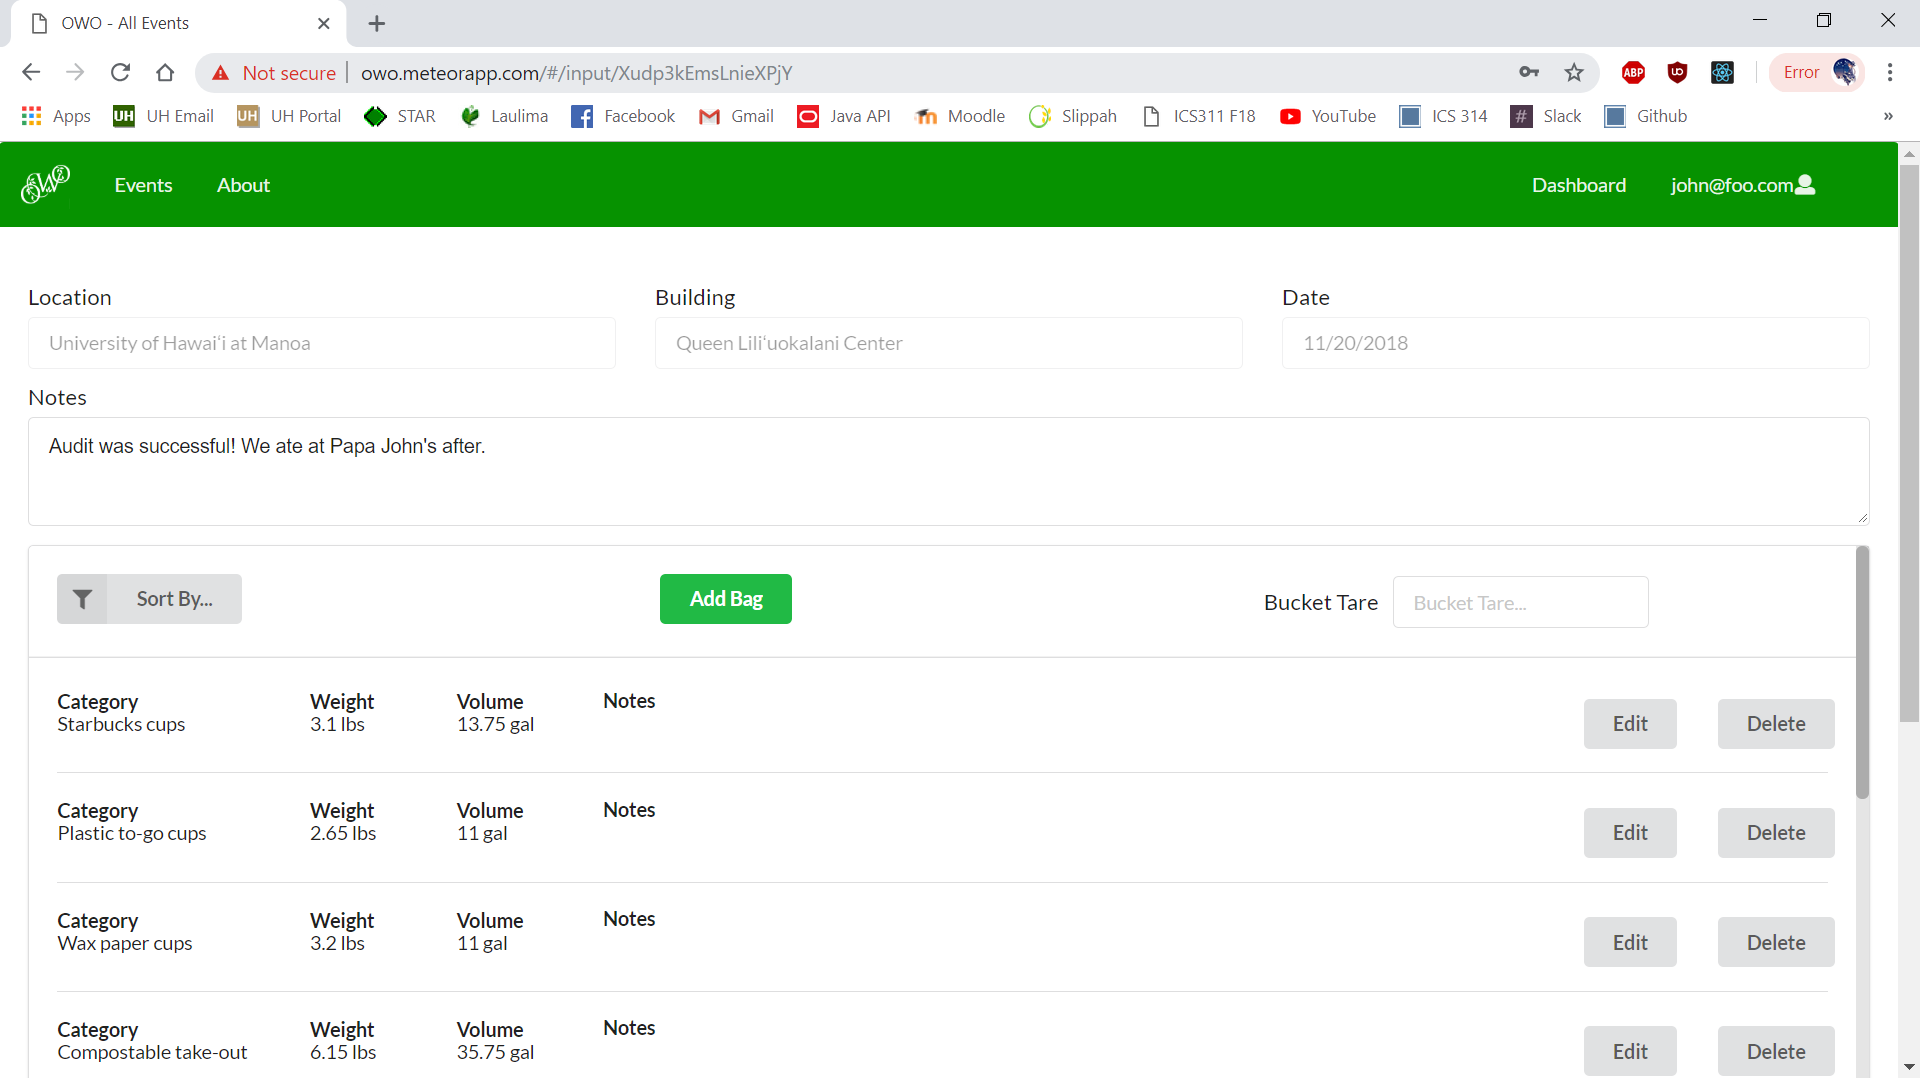
Since gathering data about the types of trash per building within a UH campus is a pretty big deal, we locked our input page behind user accounts. There are two types of user accounts. Regular users have access to the Input page, which is our main purpose of our application.
Admin Privileges
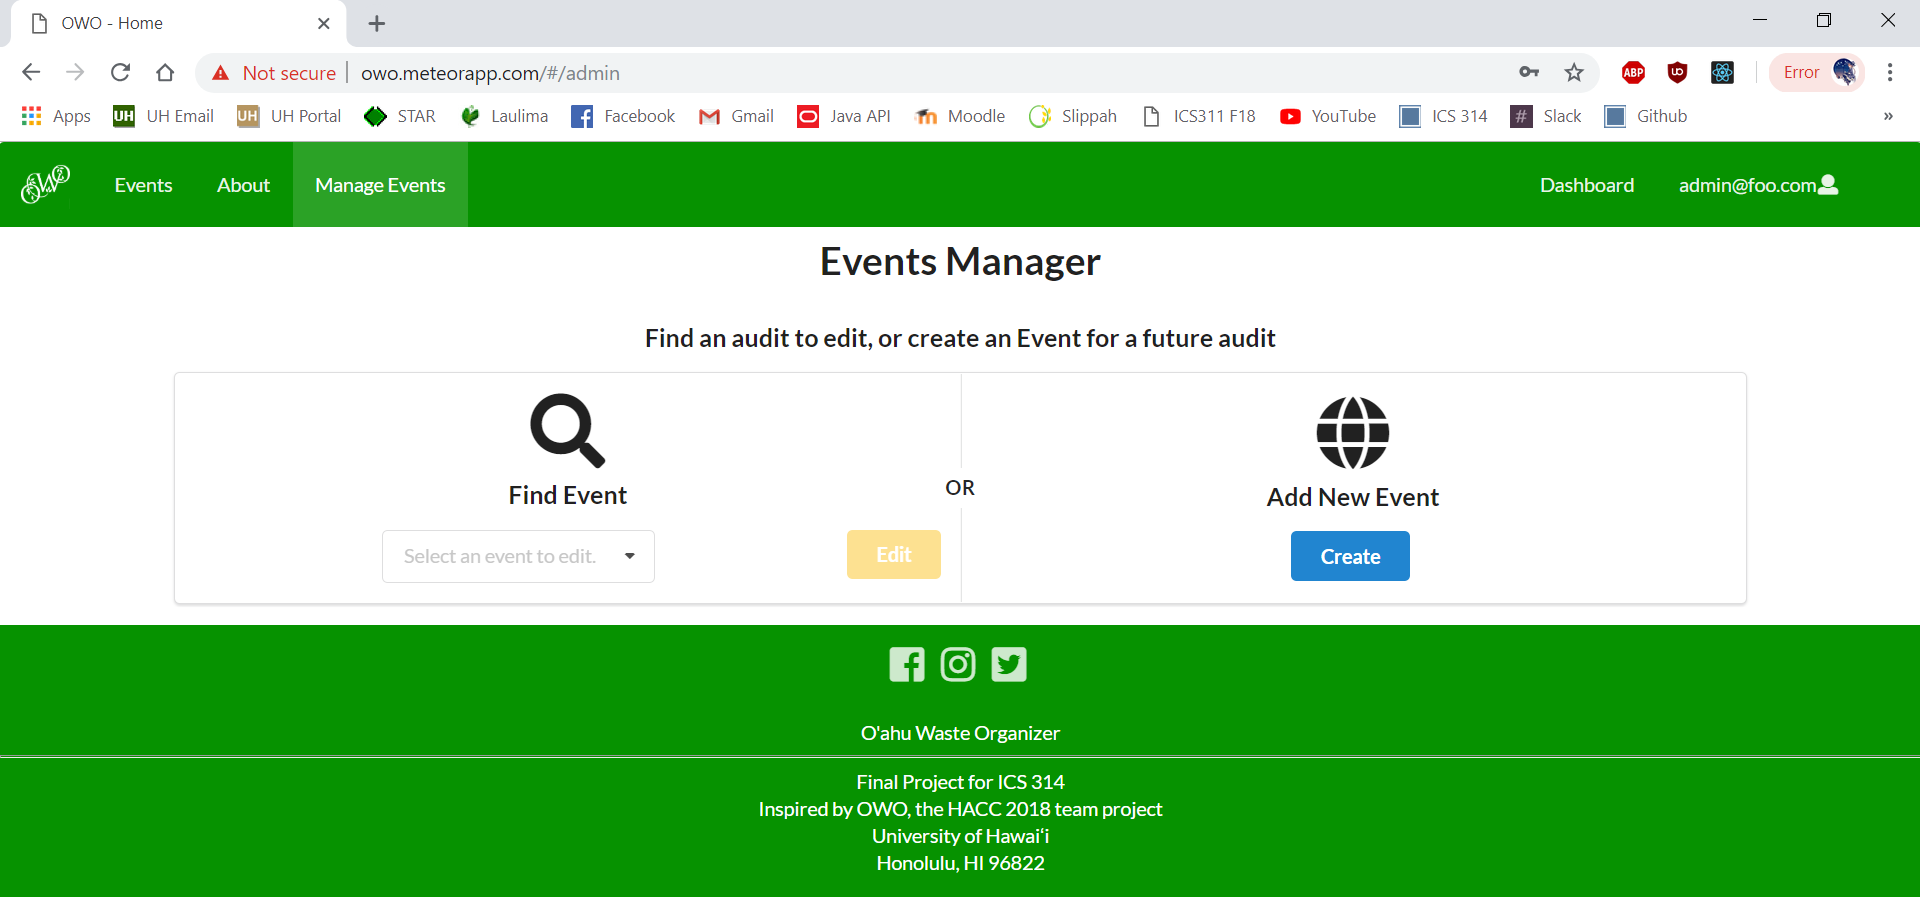
Admins have access to the Event Manager, where admins can create or edit events. The Events page also has shortcuts to editing and creating events as well.
Dashboard
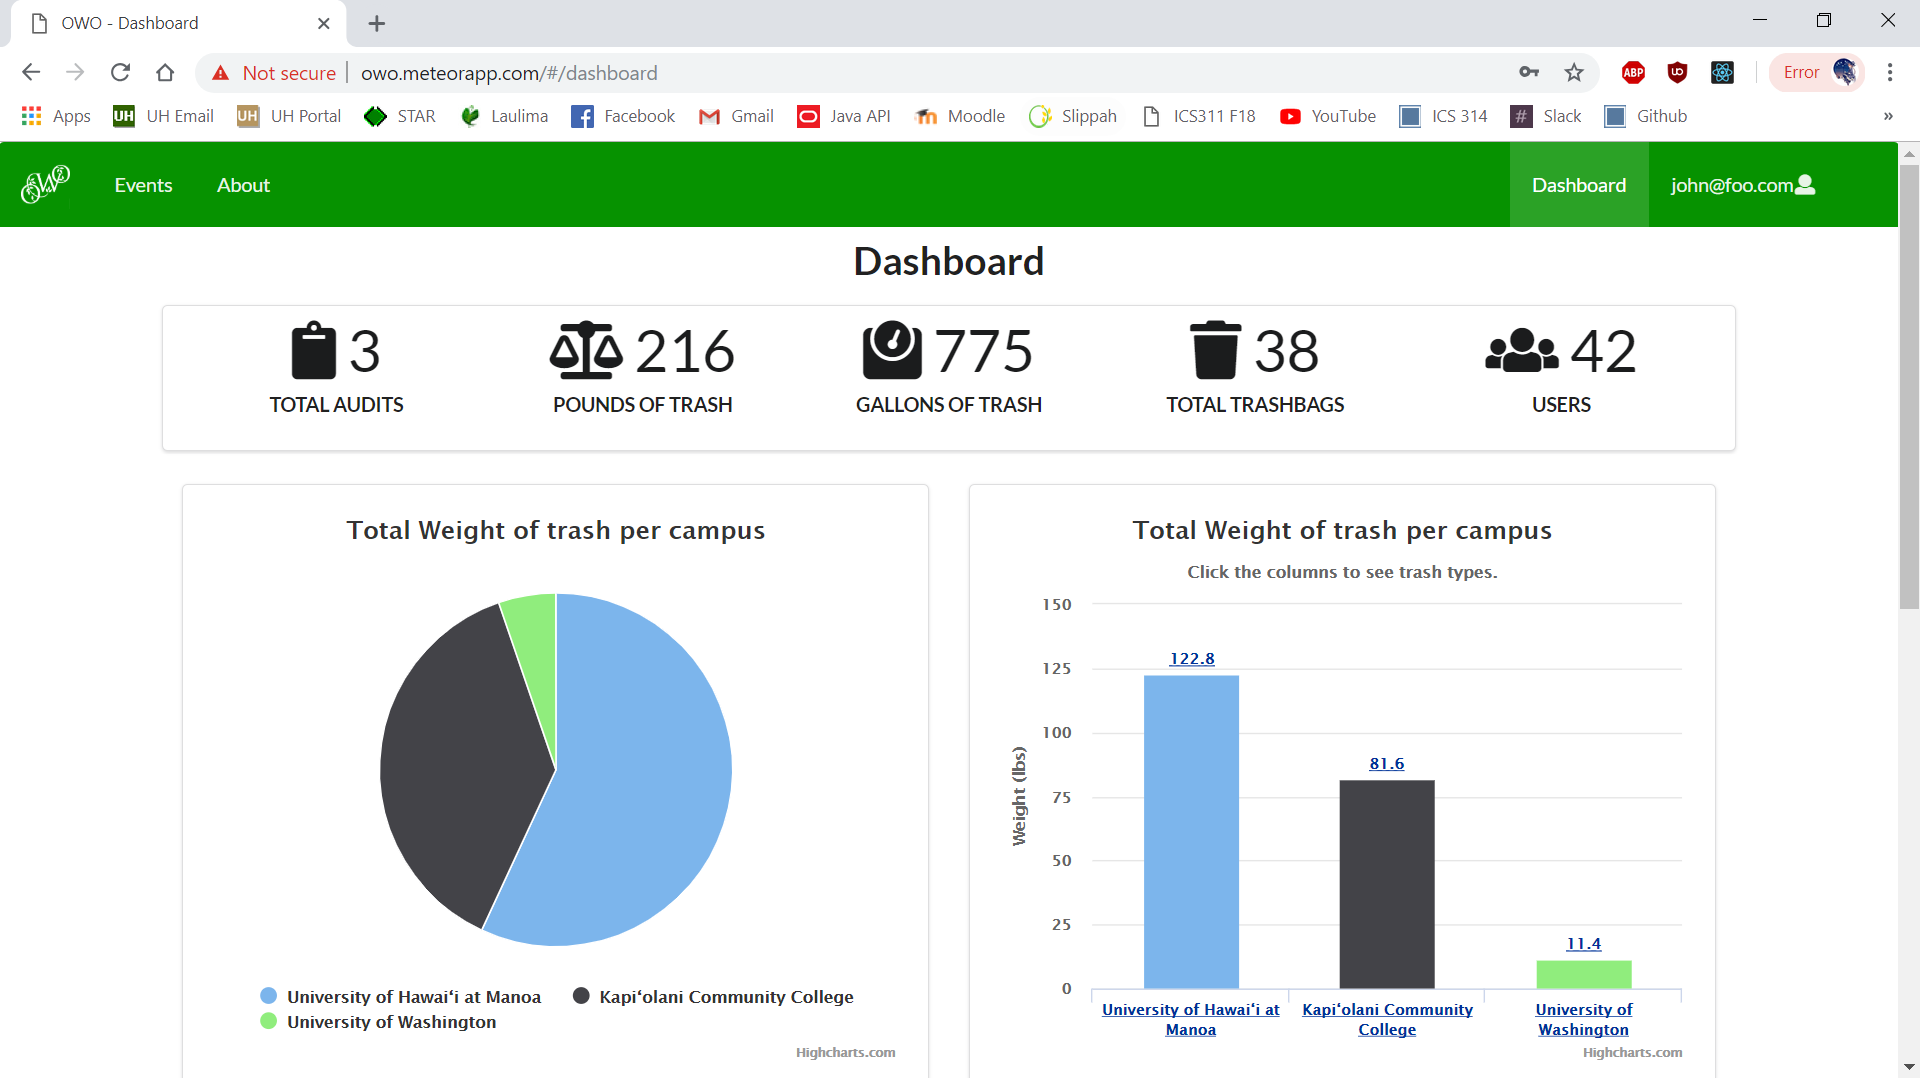
And last but not least, all users have access to the Dashboard, an in-depth statistics page that displays all audit data in a convenient manner.
The application was developed over the span of three weeks. Although there are some bugs and features we haven’t been able to implement, we would like to develop the application further in the future.
My Contributions
Some features I developed:
- O.W.O. mockup
- Events page
- Charts and Graphs functionality
- Create and Edit Event functionality
- Dashboard page
- MongoDB database
I learned a lot from the project. I referenced the WODs, millions of videos and documentations online, and StackOverflow for all the backend issues I had faced. The biggest issue I had within the entire project was finding a working version of Highcharts for Meteor and React, and linking the data with the charts. I spent a solid four days (over the Thanksgiving weekend) just researching and fiddling with the code. It took a bit of patience and perseverance (to say the least), but via an unorthodox method of inputting data, it worked! I was so happy I almost cried.
The rest of the project was somewhat easier to create. After re-teaching myself how to fetch data from the database for use within the project, the rest was clockwork.
Final Thoughts
I had a lot of fun working on this project. Seeing this project to completion validated my passion for software development; seeing the current component I was working on come to life. Most notably, the graphs reflecting data, dashboard updating in real-time, and the entire Event Manager functionality. This project is probably THE most complex thing I have ever worked on so far; there were so many moving parts to keep track of, and every little bit of code had to be understood in order to create the best possible trash audit application we could create.
There were some functions we weren’t able to implement, such as updating the graph to use weight and volume data, but had we more time, we could definitely get it to work.